Page speed & Webtracking
A special thank you to Johannes Fröhlich and the Digital Marketing Agency Dreifive for the mutual assistance with this blog article.
With the integration of Core Web Vitals into the Google algorithm in June 2021, Pagespeed has become a crucial ranking factor. It can be decisive when it comes to displaying your website as high as possible in Google’s search results.
But Google goes even further, stating that the faster your website is, the more conversions you can expect. Hmm…
But imagine the following: You’re standing in the middle of your favourite city and decide to look for a burger joint because you just met up with an old friend. You have the latest iPhone with a perfect 5G connection.
The hunger is great. The competition is greater – a burger joint on every corner. The distraction is the biggest – the friend is already chatting with you cheerfully, and the traffic around you is noisy. Now every second counts and page load time can actually be the decisive conversion bringer for the burger joint. But even with a bad smartphone and an even worse internet connection, the desired information should be found quickly – that’s Google’s goal.
So, yes. Page load time can be crucial when it comes to whether customers find YOUR brand, trust YOUR business, and ultimately buy from YOU.
No matter what you prioritize in 2022 – revenue growth, customer retention, or scaling internationally – it all depends on the performance of YOUR website.
But what are the biggest levers when it comes to page speed optimization? And how can server-side tracking, and specifically JENTIS, help? These are the questions we will tackle in this blog post.
But first, for a better understanding, a brief explanation of what Core Web Vitals actually are:
Enlightened: Core Web Vitals in a nutshell
Core Web Vitals are THE new core metrics for Google. Together with other metrics they constitute the ranking factor “Page Experience”:
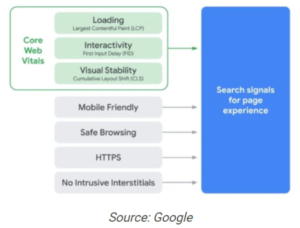
Core Web Vitals consist of three KPIs used to evaluate the usability of websites:
- Speed: Largest Contentful Paint (LCP)
- Interactivity: First Input Delay (FID)
- Stability: Cumulative Layout Shift (CLS)
| Important: Google will adjust the Core Web Vitals to the technical requirements as well as the user behavior and evaluates them regularly. Adjustments of the metrics are therefore not excluded. |
Let’s take a brief look at the key metrics below:
Largest Contentful Paint: How fast does the website load?
Largest Contentful Paint (LCP) measures the loading time that passes until the largest content element (images, videos, text blocks) in the visible area of your website is loaded.
Google defines the following values:
- good: up to 2,5 seconds
- needs improvement: 2,5 – 4 seconds
- bad: 4+ seconds
The loading status determines which the largest content element of your website is. The largest element is usually loaded at the end. The following is an example of our JENTIS website:

You can find all the details and the exact calculation basis of the LCP here in the Google documentation on Largest Contentful Paint.
First Input Delay: When can the user interact with the website?
In a nutshell: First Input Delay (FID) measures the amount of time that elapses between the first user interaction with the website and the browser response.
When you visit a website, you may click a button without waiting for the website to fully load. However, the browser usually does not react at that time because it is busy loading the website. To prevent users from jumping off now, the FID measures how much delay passes between the user input and the browser’s response. The main factor for the calculation is the “Time to Interactive”.
Google defines the following values:
- good: up to 100ms
- needs improvement: 100-300ms
- bad: 300 ms or more
You can find all details about the FID here in the Google documentation about the First Input Delay.
Cumulative Layout Shift: How stable is the website?
In a nutshell: The Cumulative Layout Shift (CLS) indicates whether and to what extent unexpected layout changes occur while the user interacts with your website.
Unexpected layout changes happen when layout shifts occur as the site loads, and elements slide down as other elements are reloaded. This can have undesirable consequences for the user.
Google defines the following values:
- good: 0.1
- needs improvement: 0.1-0.25
- bad: 0.25 or more
All details and the exact calculation basis of the CLS can be found here in the Google documentation on the Cumulative Layout Shift. So much for the definition of the Core Web Vitals (LCP, FID, CLS). Now let’s go into practice:
How to retrieve the Core Web Vitals
You can check how well your website is performing either via Google Lighthouse, the Google Search Console or directly in Google PageSpeed Insights. Simply enter your domain in the input field and click on “analyze”.
After a few seconds you will receive information on whether your website has passed the evaluation according to the Core Web Vitals – or not.
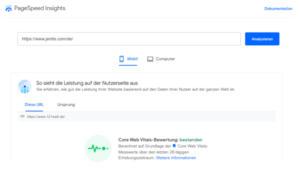
You also get a speed score for mobile and a speed score for desktop. This score is between 0 and 100, where 90-100 is good, 50-80 needs improvement and below 49 is bad.
Tip: Since March 2021, Google indexes only “mobile first”, it is important that your speed score fits mobile. As a result, it usually automatically fits for desktop as well.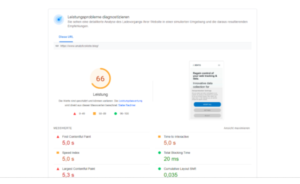
The result of the Core Web Vitals is provided as field data and lab data. Field data is anonymous data of real users on different devices and with different connection speeds. Lab data is simulated data on a single device and with a fixed network connection.
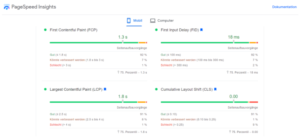
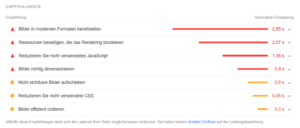
Depending on the results, you will receive a set of recommendations from Google that can be used to reduce the loading time of your website, as well as a prediction of how many seconds it can be reduced by:
What are the biggest optimization levers?
Every single recommendation from Google is a good optimization lever. However, you have to put costs and benefits in perspective (as always). Google still values good content the most. So before you invest tens of hours to make your website 100 ms faster, it probably makes more sense to invest this time in good, user-friendly content.
Links: DreiFive | Doc Largest Contentful Paint | Doc zum First Input Delay | Doc Cumulative Layout Shift | Google PageSpeed Insights
More articles
How to fix web tracking discrepancies before peak season
Numbers don’t add up, conversions are missing, dashboards show inconsistencies. Now’s the time to get your tracking in shape.
Update April 2025 - Google will not deprecate Third-Party Cookies: What it means for Digital Marketers
Google will continue to support third-party cookies indefinitely. But lessons learned from Apple’s App Tracking Transparency suggest that asking users for consent could still spell the end for the technology.
Data Privacy Update: What the U.S. Administration's Approach means for the DPF and European businesses
The Data Privacy Framework is under pressure – find out what this means for GDPR-compliant companies processing data in the US.
Mehr Beiträge
How to fix web tracking discrepancies before peak season
Numbers don’t add up, conversions are missing, dashboards show inconsistencies. Now’s the time to get your tracking in shape.
Update April 2025 - Google will not deprecate Third-Party Cookies: What it means for Digital Marketers
Google will continue to support third-party cookies indefinitely. But lessons learned from Apple’s App Tracking Transparency suggest that asking users for consent could still spell the end for the technology.
Data Privacy Update: What the U.S. Administration's Approach means for the DPF and European businesses
The Data Privacy Framework is under pressure – find out what this means for GDPR-compliant companies processing data in the US.
